Posted by Andrew.
As you might know, Google Chrome uses the WebKit rendering engine, which is shared by other browsers such as Apple's Safari. WebKit Web Inspector(Chrome Developer Tools) is implemented as an HTML + CSS + JavaScript web application. What you might not know is that Developer Tools can run outside of the browser environment and still provide complete set of its features to the end user. It has a special binding available at JavaScript runtime that allows interacting with chrome pages and instrumenting them. Interaction protocol consists of commands that are sent to the page and events that the page is generating. Although Chrome Developer Tools is the only client of this protocol, there are ways for third parties to bypass it and start instrumenting browser pages explicitly.
Debugging over the wire
Now that Web Inspector is functioning out-of-process over the serialized-message-channel, attaching Web Inspector window to the remote browser is possible. Here is an example of the remote debugging session using Chrome:
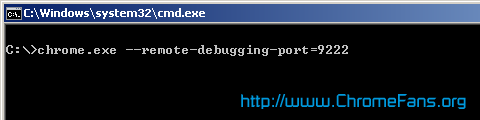
- Start your target browser with the remote-debugging-port command line switch:
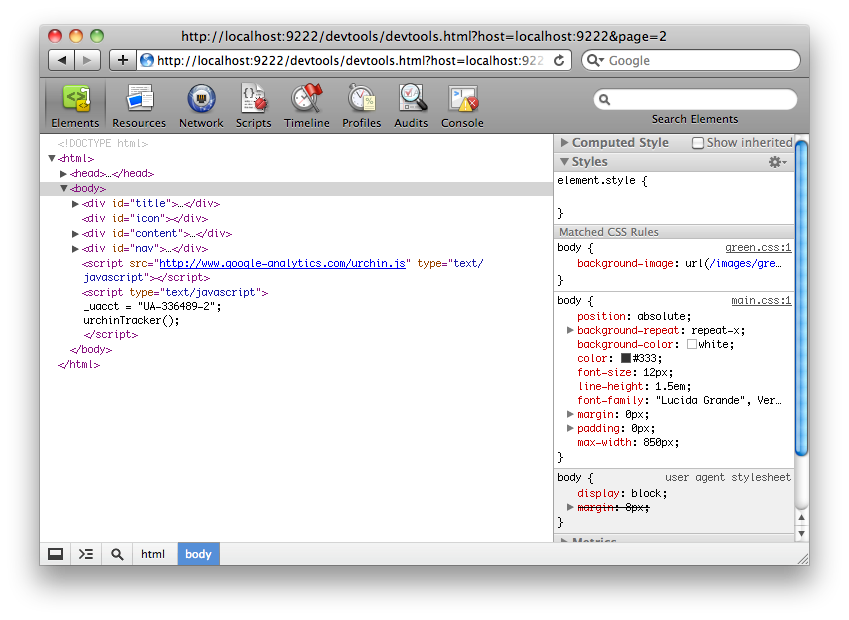
- Navigate to the given port from your client Chrome instance and attach to any of the discovered tabs for debugging.
- Follow any of these links to start remote debugging session for the corresponding page.
chrome.exe --remote-debugging-port=9222
http://localhost:9222
Remote Debugging Protocol
Under the hood, Web Inspector front-end is talking to the browser backend by means of the Remote Debugging Protocol. This protocol is based on the JSON-RPC 2.0 specification. It is bidirectional: clients send asynchronous requests to the server, server responds to these requests and/or generates notifications. More details about Remote Debugging Protocol, please visit the document of WebKit Remote Debugging.
Other resources about Chrome Remote Debugging
- Webmaster: How to test my website in Google Chrome?
- Developers and Webmasters Resource about Google Chrome
- Chromium Blog: Remote debugging with Chrome Developer Tools
- Webkit document: WebKit Remote Debugging
- Chrome document: Chrome Developer Tools: Remote Debugging
- Microsoft: Remote Debugging Setup - Visual Studio supports remote debugging from one computer to another. When you are doing remote debugging, the host computer can be any platform that supports Visual Studio. The remote computer can be a 32-bit or 64-bit platform.
- Google I/O: countdown to the keynote kickoff
- Improving finger dexterity for faster web browsing
- Previous article: Paid Apps: Chrome Web Store vs Mac App Store vs Google Android Market
- Next article: How to block ads in Google Chrome
How to remote debug with Chrome developer tools